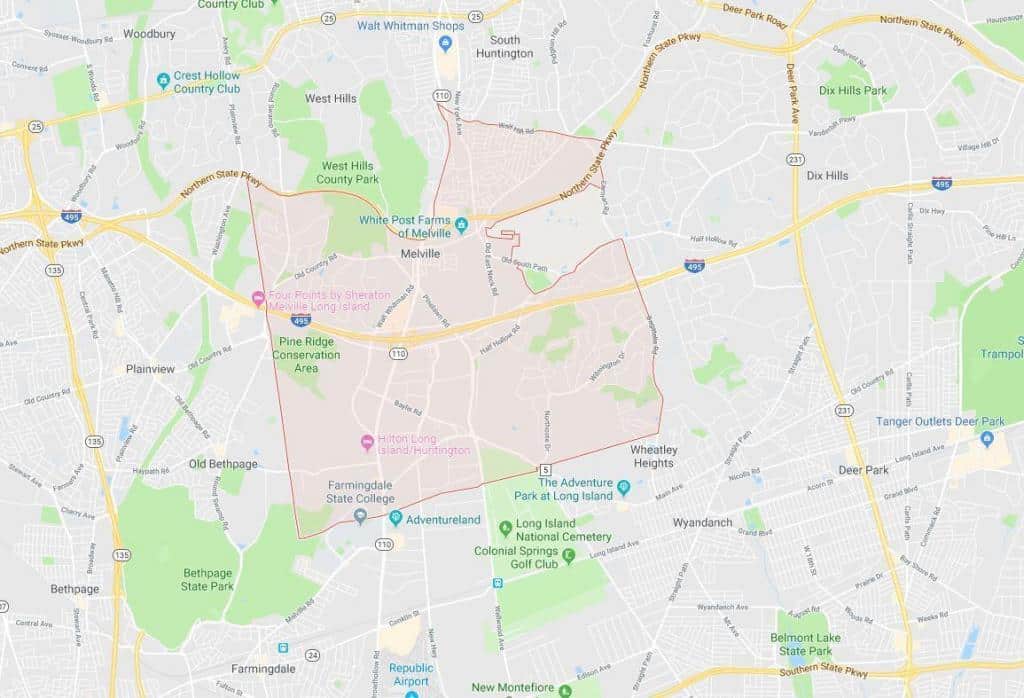
Melville Property Tax Grievance
Fill out 1 Simple Form & We Will Handle the Rest
- We Handle All Paperwork
- No One Will Visit Your Home
- Tax Grievance Filing Won’t Raise Your Taxes
- NO REDUCTION = NO FEE – We Fight For Every Dollar
- No Upfront Fees
- Record Reductions for Our Clients
Suffolk County Will Not Voluntarily Reduce Your Assessed Value!
Paying high property taxes in Bayport? Heller & Consultants Tax Grievance can help. We’ve received historic record tax reductions for many of your Bayport neighbors in recent years that no other tax grievance service can claim. We can help you too!
Applying is simple, just click here or the Apply Online button on this page to begin saving. Best of all, if you don’t save, you don’t pay!
Please visit “Our Reductions” page to see how much we have saved your neighbors.
Our Record Suffolk County
Property Tax Reductions!
$17,000/yr Old Field Rd, Setauket
$13,000/yr Old Field Rd, Setauket
$9,000/yr Old Field Rd, Setauket
$7,000/yr China Ln, East Setauket
Interesting facts about the city of Melville: Suffolk NY
Melville is an affluent hamlet and census-designated place (CDP) in the Town of Huntington in Suffolk County on Long Island, New York, in the United States. The population was 18,985 at the 2010 census.
Melville lies directly east of the boundary with Nassau County. The Long Island Expressway (LIE) and Northern State Parkway, two of the country’s busiest highways and major points of entry in and out of New York City, pass through Melville. Melville is located immediately off Exit 49 of the LIE. New York State Route 110 runs through the center of Melville.
As of the census of 2000, there were 14,533 people, 4,930 households, and 3,993 families residing in the CDP. The population density was 1,284.0 per square mile (495.7/km²). There were 5,141 housing units at an average density of 454.2/sq mi (175.3/km²). The racial makeup of the CDP was 89.93% White, 2.06% Black, 0.03% Native American, 5.42% Asian, 0.07% Pacific Islander, 1.04% from other races, and 1.44% from two or more races. Hispanic or Latino of any race were 3.72% of the population.
There were 4,930 households out of which 38.1% had children under the age of 18 living with them, 72.2% were married couples living together, 6.6% had a female householder with no husband present, and 19.0% were non-families. 15.7% of all households were made up of individuals and 6.8% had someone living alone who was 65 years of age or older. The average household size was 2.88 and the average family size was 3.23.


